[sc name=”ad_1″]
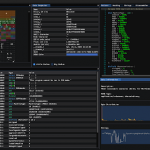
teler is an real-time intrusion detection and threat alert based on web log that runs in a terminal with resources that we collect and provide by the community.
Features
- Real-time: Analyze logs and identify suspicious activity in real-time.
- Alerting: teler provides alerting when a threat is detected, push notifications include Slack, Telegram and Discord.
- Monitoring: We’ve our own metrics if you want to monitor threats easily, and we use Prometheus for that.
- Latest resources: Collections is continuously up-to-date.
- Minimal configuration: You can just run it against your log file, write the log format and let teler analyze the log and show you alerts!
- Flexible log formats: teler allows any custom log format string! It all depends on how you write the log format in configuration file.
- Incremental log processing: Need data persistence rather than buffer stream? teler has the ability to process logs incrementally through the on-disk persistence options.
Why teler?
teler was designed to be a fast, terminal-based threat analyzer. Its core idea is to quickly analyze and hunt threats in real time!
Installation
from Binary
The installation is easy. You can download a prebuilt binary from releases page, unpack and run! or run with:
▶ curl -sSfL 'https://ktbs.dev/get-teler.sh' | sh -s -- -b /usr/local/binusing Docker
Pull the Docker image by running:
▶ docker pull kitabisa/telerfrom Source
If you have go1.14+ compiler installed and configured:
▶ GO111MODULE=on go get -v -u ktbs.dev/teler/cmd/telerIn order to update the tool, you can use -u flag with go get command.
from GitHub
▶ git clone https://github.com/kitabisa/teler
▶ cd teler
▶ make build
▶ mv ./bin/teler /usr/local/bin
Usage
Simply, teler can be run with:
▶ [buffers] | teler -c /path/to/config/teler.yaml
# or
▶ teler -i /path/to/access.log -c /path/to/config/teler.yaml
If you’ve built teler with a Docker image:
▶ [buffers] | docker run -i --rm -e TELER_CONFIG=/path/to/config/teler.yaml teler
# or
▶ docker run -i --rm -e TELER_CONFIG=/path/to/config/teler.yaml teler --input /path/to/access.log
Flags
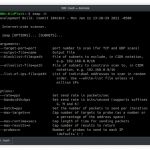
▶ teler -hThis will display help for the tool.
Here are all the switches it supports.
| Flag | Description | Examples |
|---|---|---|
| -c, –config |
teler configuration file | kubectl logs nginx | teler -c /path/to/config/teler.yaml |
| -i, –input |
Analyze logs from data persistence rather than buffer stream | teler -i /var/log/nginx/access.log |
| -x, –concurrent |
Set the concurrency level to analyze logs (default: 20) |
tail -f /var/log/nginx/access.log | teler -x 50 |
| -o, –output |
Save detected threats to file | teler -i /var/log/nginx/access.log -o /tmp/threats.log |
| –json | Display threats in the terminal as JSON format | teler -i /var/log/nginx/access.log –json |
| –rm-cache | Remove all cached resources | teler –rm-cache |
| -v, –version |
Show current teler version | teler -v |
Config
The -c flag is to specify teler configuration file.
▶ tail -f /var/log/nginx/access.log | teler -c /path/to/config/teler.yamlThis is required, but if you have defined TELER_CONFIG environment you don’t need to use this flag, e.g.:
▶ export TELER_CONFIG="/path/to/config/teler.yaml"
▶ tail -f /var/log/nginx/access.log | teler
# or
▶ tail -f /var/log/nginx/access.log | TELER_CONFIG="/path/to/config/teler.yaml" teler
Input
Need log analysis incrementally? This -i flag is useful for that.
▶ teler -i /var/log/nginx/access.logConcurrency
Concurrency is the number of logs analyzed at the same time. Default value teler provide is 20, you can change it by using -x flag.
▶ teler -i /var/log/nginx/access.log -x 50Output
You can also save the detected threats into a file with -o flag.
▶ teler -i /var/log/nginx/access.log -o threats.logJSON Format
If you want to display the detected threats as JSON format, switch it with --json flag.
▶ teler -i /var/log/nginx/access.log --jsonPlease note this will also apply if you save it to a file with -o flag.
Remove Caches
It will removes all stored resources in the user-level cache directory, see cache.
▶ teler --rm-cacheConfiguration
teler requires a minimum of configuration to process and/or log analysis, and execute threats and/or alerts. See teler.example.yaml for an example.
Log Formats
Because we use gonx package to parse the log, you can write any log format. As an example:
Apache
log_format: |
  $remote_addr - $remote_user [$time_local] "$request_method $request_uri $request_protocol" $status $body_bytes_sent
Nginx
log_format: |
  $remote_addr $remote_user - [$time_local] "$request_method $request_uri $request_protocol"
  $status $body_bytes_sent "$http_referer" "$http_user_agent"
Nginx Ingress
log_format: |
  $remote_addr - [$remote_addr] $remote_user - [$time_local]
  "$request_method $request_uri $request_protocol" $status $body_bytes_sent
  "$http_referer" "$http_user_agent" $request_length $request_time
  [$proxy_upstream_name] $upstream_addr $upstream_response_length $upstream_response_time $upstream_status $req_id
Amazon S3
log_format: |
  $bucket_owner $bucket [$time_local] $remote_addr $requester $req_id $operationration $key
  "$request_method $request_uri $request_protocol" $status $error_code $body_bytes_sent -
  $total_time - "$http_referer" "$http_user_agent" $version_id $host_id
  $signature_version $cipher_suite $http_auth_type $http_host_header $tls_version
Elastic LB
log_format: |
  $time_local $elb_name $remote_addr $upstream_addr $request_processing_time
  $upstream_processing_time $response_processing_time $status $upstream_status $body_received_bytes $body_bytes_sent
  "$request_method $request_uri $request_protocol" "$http_user_agent" $cipher_suite $tls_version
CloudFront
log_format: |
  $date $time $edge_location  $body_bytes_sent  $remote_addr
  $request_method $http_host_header $requst_uri $status
  $http_referer $http_user_agent  $request_query  $http_cookie  $edge_type  $req_id
  $http_host_header $ssl_protocol $body_bytes_sent  $response_processing_time $http_host_forwarded
  $tls_version  $cipher_suite $edge_result_type $request_protocol $fle_status $fle_encrypted_fields
  $http_port  $time_first_byte  $edge_detail_result_type
  $http_content_type  $request_length $request_length_start $request_length_end
Threat rules
Cache
By default, teler will fetch external resources every time you run it, but you can switch external resources to be cached or not.
rules:
  cache: true
If you choose to cache resources, it’s stored under user-level cache directory of cross-platform and will be updated every day, see resources.
Excludes
We include resources for predetermined threats, including:
- Common Web Attack
- Bad IP Address
- Bad Referrer
- Bad Crawler
- Directory Bruteforce
You can disable any type of threat in the excludes configuration (case-sensitive).
rules:
  threat:
    excludes:
      - "Bad IP Address"
The above format detects threats that are not included as bad IP address, and will not analyze logs/ send alerts for that type.
Whitelists
You can also add whitelists to teler configuration.
rules:
  threat:
    whitelists:
      - "(curl|Go-http-client|okhttp)/*"
      - "^/wp-login.php"
It covers the entire HTTP request and processed as regExp, please write it with caution!
Notification
We provide alert notification options:
- Slack,
- Telegram
- Discord
Configure the notification alerts needed on:
notifications:
  slack:
    token: "xoxb-..."
    color: "#ffd21a"
    channel: "G30SPKI"
telegram:
token: “123456:ABC-DEF1234…-…”
chat_id: “-111000”
discord:
token: “NkWkawkawkawkawka.X0xo.n-kmZwA8aWAA”
color: “16312092”
channel: “700000000000000…”
You can also choose to disable alerts or want to be sent where the alerts are.
alert:
  active: true
  provider: "slack"
Metrics
teler also supports metrics using Prometheus.
Prometheus
You can configure the host, port and endpoint to use Prometheus metrics in the configuration file.
prometheus:
  active: true
  host: "localhost"
  port: 9099
  endpoint: "/metrics"
Here are all the metrics we collected & categorized.
| Metric | Description |
|---|---|
teler_threats_count_total |
Total number of detected threats |
teler_cwa |
Get lists of Common Web Attacks |
teler_badcrawler |
Get lists of Bad Crawler requests |
teler_dir_bruteforce |
Get lists of Directories Bruteforced |
teler_bad_referrer |
Get lists of Bad Referrer requests |
teler_badip_count |
Total number of Bad IP Addresses |
Resources
All external resources used in this teler are NOT provided by us. See all peoples who involved in this resources at teler Resource Collections.
[sc name=”ad-in-article”]









Add Comment