


[sc name=”ad_1″]
HyperDbg is designed with a focus on using modern hardware technologies to provide new features to the reverse engineering world. It operates on top of Windows by virtualizing an already running system using Intel VT-x and Intel PT. This debugger aims not to use any APIs and software debugging mechanisms, but instead, it uses Second Layer Page Table (a.k.a. Extended Page Table or EPT) extensively to monitor both kernel and user executions.
HyperDbg comes with features like hidden hooks, which is as fast as old inline hooks, but also stealth. It mimics hardware debug registers for (read & write) to a specific location, but this time entirely invisible for both Windows kernel and the programs, and of course without any limitation in size or count!
Using TLB-splitting, and having features such as measuring code coverage and monitoring all mov(s) to/from memory by a function, makes HyperDbg a unique debugger.
Although it has novel features, HyperDbg tries to be as stealth as possible. It doesn’t use any debugging APIs to debug Windows or any application, so classic anti-debugging methods won’t detect it. Also, it resists the exploitation of time delta methods (e.g., RDTSC/RDTSCP) to detect the presence of hypervisors, therefore making it much harder for applications, packers, protectors, malware, anti-cheat engines, etc. to discover the debugger.
Unique Features
First Release (v0.1.0.0)
- Classic EPT Hook (Hidden Breakpoint) [link][link]
- Inline EPT Hook (Inline Hook) [link][link]
- Monitor Memory For R/W (Emulating Hardware Debug Registers Without Limitation) [link][link]
- SYSCALL Hook (Disable EFER & Handle #UD) [link][link]
- SYSRET Hook (Disable EFER & Handle #UD) [link][link]
- CPUID Hook & Monitor [link]
- RDMSR Hook & Monitor [link]
- WRMSR Hook & Monitor [link]
- RDTSC/RDTSCP Hook & Monitor [link]
- RDPMC Hook & Monitor [link]
- VMCALL Hook & Monitor [link]
- Debug Registers Hook & Monitor [link]
- I/O Port (In Instruction) Hook & Monitor [link]
- I/O Port (Out Instruction) Hook & Monitor [link]
- MMIO Monitor
- Exception (IDT < 32) Monitor [link][link]
- External-Interrupt (IDT > 32) Monitor [link][link]
- Running Automated Scripts [link]
- Transparent-mode (Anti-debugging and Anti-hypervisor Resistance) [link]
- Running Custom Assembly In Both VMX-root, VMX non-root (Kernel & User) [link]
- Checking For Custom Conditions [link][link]
- Script Engine [link][link][link]
- VMX-root Compatible Message Tracing [link]
- Powerful Kernel Side Scripting Engine [link][link]
- Event Forwarding (#DFIR) [link][link]
- Transparent Breakpoint Handler
- Various Custom Scripts [link]
Second Release (v0.2.0.0)
(not released yet !)
Installation
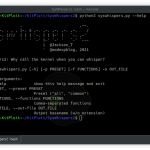
Please visit Build & Install and Quick Start for a detailed explanation of how to start with HyperDbg.
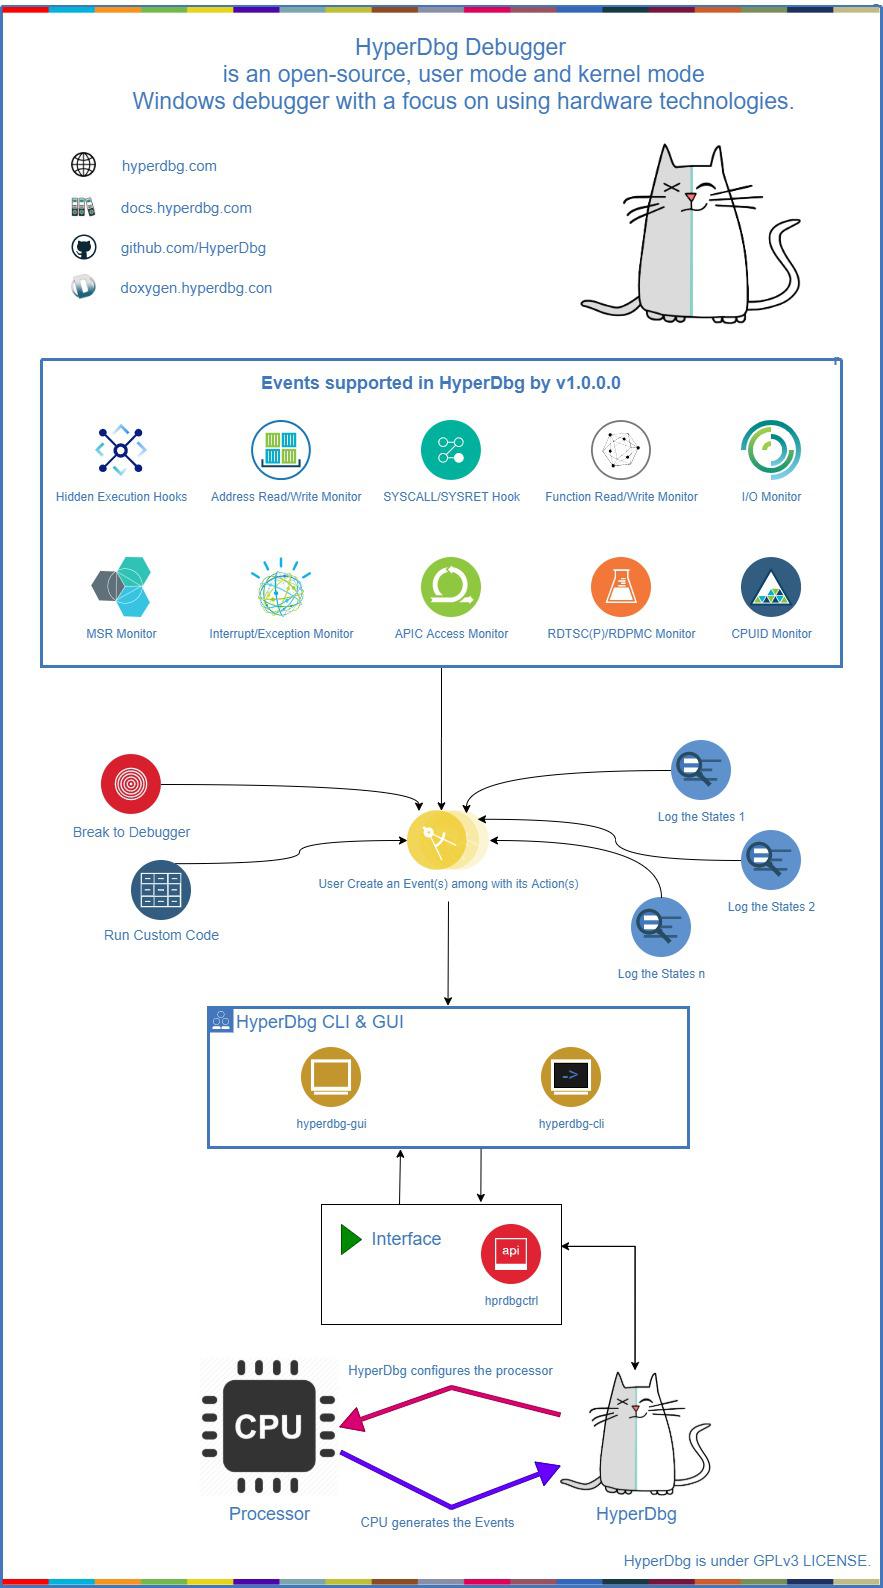
How does it work?
We explained about how HyperDbg internally works and how we designed its features in details, take a look at :
(https://docs.hyperdbg.com/design)
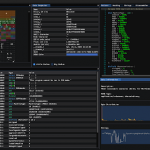
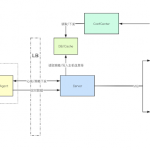
Here’s a diagram that shows how HyperDbg works !
Plugins
The plugin framework is not ready for the current version of HyperDbg. Future versions will support plugins.
Contributing
Contributing in HyperDbg is super appreciated.
If you want to create a pull request or contribute in HyperDbg please read Contribution Guide.
[sc name=”ad-in-article”]

Add Comment