


[sc name=”ad_1″]
A tool to assess data quality, built on top of the awesome OSSEM project.
Mission
- Answer the question: I want to start hunting ATT&CK techniques, what log sources and events are more suitable?
- Create transparency on the strengths and weaknesses of your log sources
- Provide an easy way to evaluate your logs
OSSEM Power-up Overview
Power-up uses OSSEM Detection Data Model (DDM) as the foundation of its data quality assessment. The main reason for this is because it provides a structured way to correlate ATT&CK Data Sources, Common information model entities (CIM), and Data Dictionaries (events) with each other.
For those unfamiliar the DDM structure, here is a sample:
| ATT&CK Data Source | Sub Data Source | Source Data Object | Relationship | Destination Data Object | EventID |
|---|---|---|---|---|---|
| Process monitoring | process creation | process | created | process | 4688 |
| Process monitoring | process creation | process | created | process | 1 |
| Process monitoring | process termination | process | terminated | – | 4689 |
| Process monitoring | process termination | process | terminated | – | 5 |
As you can see each entry in the DDM defines a sub data source (scope) using abstract entities like process, user, file, etc. Each of these entries also contain an event ID, where the scope applies. You can read more about these entitites here.
In a nutshell, DDM entries play a major role on removing the complexity of raw events, by providing a scope that defines how a log source (data channels) can be consumed.
Data Quality Dimensions
Power-up assesses data quality score according to five distinct dimensions:
| Dimension | Type | Description |
|---|---|---|
| Coverage | Data channel | How many devices or network segments are covered by the data channel |
| Timeliness | Data channel | How long does it take for the event to be available |
| Retention | Data channel | How long does the event remain available |
| Structure | Event | How complete is the event, if relevant fields are available |
| Consistency | Event | How standard are the event fields, if fields have been normalized |
Every dimension is rated with a score between 0 (none) to 5 (excelent).
Coverage, Timeliness and Retention
These dimensions are tied to data channels, and propagate to all events provided by it.
Due to the nature of these dimensions, they must be rated manually, according to the specifities of the data channels.
Power-up uses resources/dcs.yml to define data channel and rate the dimensions:
data channel: sysmon
description: sysmon monitoring
coverage: 2
timeliness: 5
retention: 2
---
data channel: security
description: windows security auditing
coverage: 5
timeliness: 5
retention: 2
Structure
In order to calculate how complete the event structure is, power-up compares the data dictionary standard names with the fields of the entities (CIM) referenced in the DDM entry (source and destination).
Because not all entity fields are relevant (depends on the context), power-up uses the concept of profiles to select which fields need to match the data dictionary standard names. For example:
# OSSEM CIM Profile
process:
    - process_name
    - process_path
- process_command_lineNote: There is an example profile in
profiles/default.ymlfor you to play with.
The structure score is calculated with the following formula:
SCORE_PERCENT = (MATCHED_FIELDS / TOTAL_RELEVANT_FIELDS) * 100
For the sake of clarity, here is an example of how structure score is calculated:
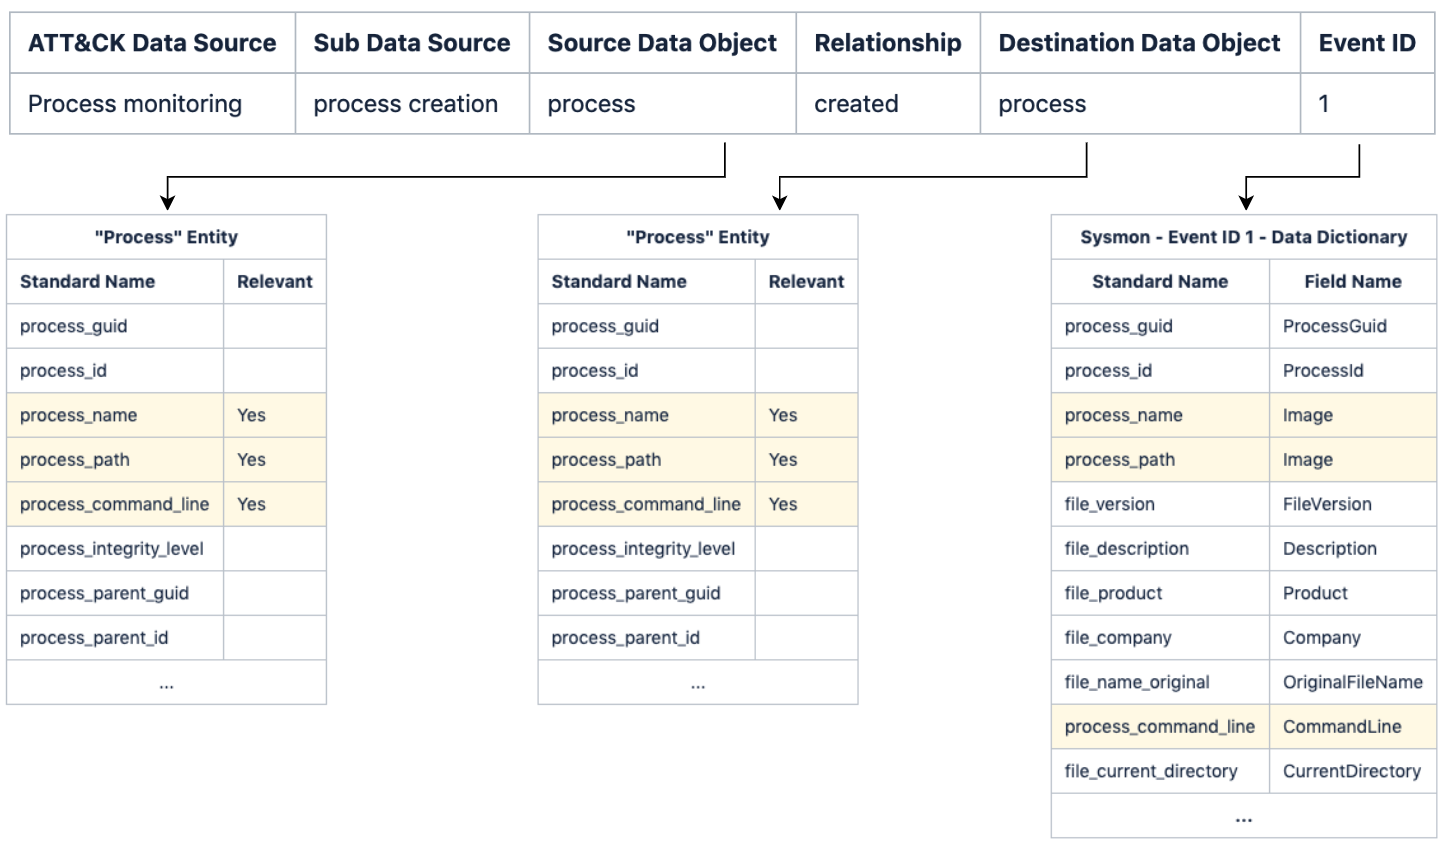
Note: Because Sysmon Event Id 1 data dictionary matches 100% of the relevant entity fields, the structure score will be rated as 5 (excelent).
The structure score is translated to the 0-5 scale in the following way:
| Percentage | Score |
|---|---|
| 0 | 0 |
| 1 to 25 | 1 |
| 26 to 50 | 2 |
| 51 to 75 | 3 |
| 76 to 99 | 4 |
| 100 | 5 |
Note: Depending on the use case (SIEM, Threat Hunting, Forensics), you can define different profiles so that you can rate your logs differently.
Consistency
To calculate consistency, power-up simply calculates the percentage of fields with a standard name in a data dictionary. Data dictionaries with a high number of fields mapped to a standard name are more likely to correlate with CIM entities.
The consistency score is calculated with the following formula:
SCORE_PERCENT = (STANDARD_NAME_FIELDS / TOTAL_FIELDS) * 100
The consistency score is translated to the 0-5 scale in the following way:
| Percentage | Score |
|---|---|
| 0 | 0 |
| 1 to 50 | 1 |
| 51 to 99 | 3 |
| 100 | 5 |
How to use
Before you start
- Power-up is a python script, be sure to
pip install -r requirements.txt - Be sure to have a local copy of OSSEM repository
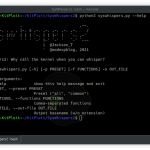
Running power-up
$> python3 powerup.py --help
  _____ _____ _____ _____ _____    _____ _____ _ _ _ _____ _____     _____ _____ __
 |     |   __|   __|   __|     |  |  _  |     | | | |   __| __  |___|  |  |  _  |  |
 |  |  |__   |__   |   __| | | |  |   __|  |  | | | |   __|    -|___|  |  |   __|__|
 |_____|_____|_____|_____|_|_|_|  |__|  |_____|_____|_____|__|__|   |_____|__|  |__|
usage: powerup.py [-h] [-o OSSEM] [-y OSSEM_YAML] [-p PROFILE] [--excel]
[--elastic] [--yaml]
A tool to assess ATT&CK data source coverage, built on top of awesome OSSEM.
optional arguments:
-h, --help show this help message and exit
-o OSSEM, --ossem OSSEM
path to import OSSEM markdown
-y OSSEM_YAML, --ossem-yaml OSSEM_YAML
path to import OSSEM yaml
-p PROFILE, --profile PROFILE
path to CIM profile
--excel export OSSEM DDM to excel
--elastic export OSSEM data models to elastic
--yaml export OSSEM data models to yaml
--layer export OSSEM data models to navigator layer
As you can see power-up can consume OSSEM data from two different formats:
- OSSEM markdown – The native format of OSSEM when you clone from git.
- OSSEM yaml – A sumarized format of OSSEM, only the data fields and a few metadata. You can power-up to convert OSSEM markdown to yaml.
Currently, Power-up exports OSSEM output to:
- Yaml – Creates OSSEM structures in yaml, in the
output/folder - Excel – Creates an OSSEM DDM table, enriched with the data quality scores, in the
ouput/folder - Elastic – Creates an OSSEM structure in elastic, the indexes are as follows:
- ossem.ddm – OSSEM DDM table, enriched with the data quality scores
- ossem.cim – OSSEM CIM entries
- ossem.dds – OSSEM Data Dictionaries
- ossem.dcs – OSSEM Data Channels
Note: if no profile file path is specified power-up uses
profiles/default.ymlby default.
Exporting to YAML
$> python3 powerup.py -o ../OSSEM --yaml
  _____ _____ _____ _____ _____    _____ _____ _ _ _ _____ _____     _____ _____ __
 |     |   __|   __|   __|     |  |  _  |     | | | |   __| __  |___|  |  |  _  |  |
 |  |  |__   |__   |   __| | | |  |   __|  |  | | | |   __|    -|___|  |  |   __|__|
 |_____|_____|_____|_____|_|_|_|  |__|  |_____|_____|_____|__|__|   |_____|__|  |__|
[*] Profile path: profiles/default.yml
[*] Parsing OSSEM from markdown
[*] Exporting OSSEM to YAML
[*] Created output/ddm_20191114_160246.yml
[*] Created output/cim_20191114_160246.yml
[*] Created output/dds_20191114_160246.yml
The goal of exporting/importing to/from YAML is to facilitate OSSEM customization. Chances are that the first you will do is create your own data dictionaries, and then add new DDM entries, so YAML will make updates easier.
Note 1: modify
resources/config.ymlto instruct power-up about the file names for the correct structures. Then you just need to place then in a folder and pass to OSSEM_YAML argument.
Note 2: power-up does not parse the entire OSSEM objects to YAML, only the data fields and some metadata (i.e. description). The reason for this is that I wanted to keep the YAML object as lean as possible, just with the data you need to assess data quality.
Exporting to EXCEL
$> python3 powerup.py -o ../OSSEM --excel
_____ _____ _____ _____ _____ _____ _____ _ _ _ _____ _____ _____ _____ __
| | __| __| __| | | _ | | | | | __| __ |___| | | _ | |
| | |__ |__ | __| | | | | __| | | | | | __| -|___| | | __|__|
|_____|_____|_____|_____|_|_|_| |__| |_____|_____|_____|__|__| |_____|__| |__|
[*] Profile path: profiles/default.yml
[*] Parsing OSSEM from markdown
[*] Exporting OSSEM DDM to Excel
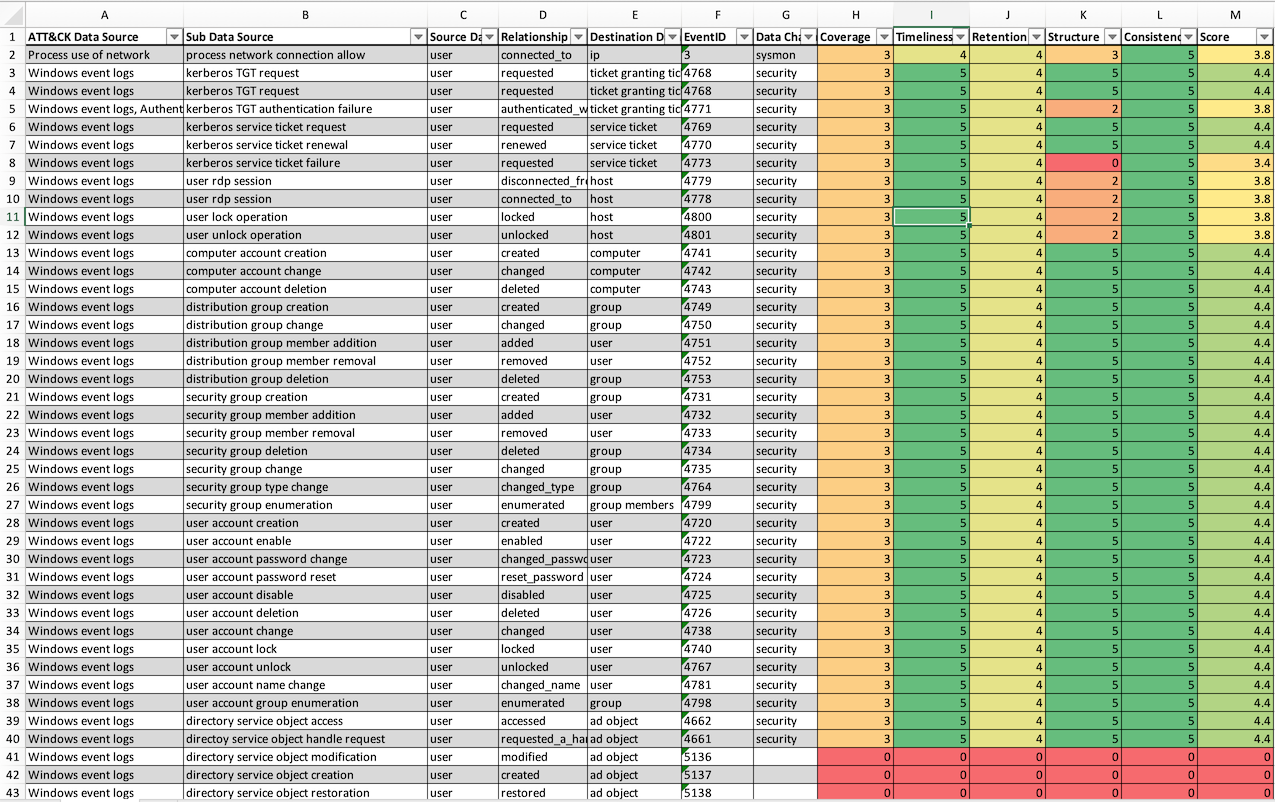
[*] Saved Excel to output/ddm_enriched_20191114_160041.xlsxWhen exporting to Excel, power-up will create an eye-candy DDM, with the respective data quality dimensions for every entry:
Exporting to ELASTIC
$> python3 powerup.py -o ../OSSEM --elastic
_____ _____ _____ _____ _____ _____ _____ _ _ _ _____ _____ _____ _____ __
| | __| __| __| | | _ | | | | | __| __ |___| | | _ | |
| | |__ |__ | __| | | | | __| | | | | | __| -|___| | | __|__|
|_____|_____|_____|_____|_|_|_| |__| |_____|_____|_____|__|__| |_____|__| |__|
[*] Profile path: profiles/default.yml
[*] Parsing OSSEM from markdown
[*] Exporting OSSEM to Elastic
[*] Creating elastic index ossem.ddm
[*] Creating elastic index ossem.cim
[*] Creating elastic index ossem.dds
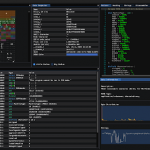
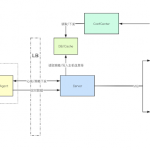
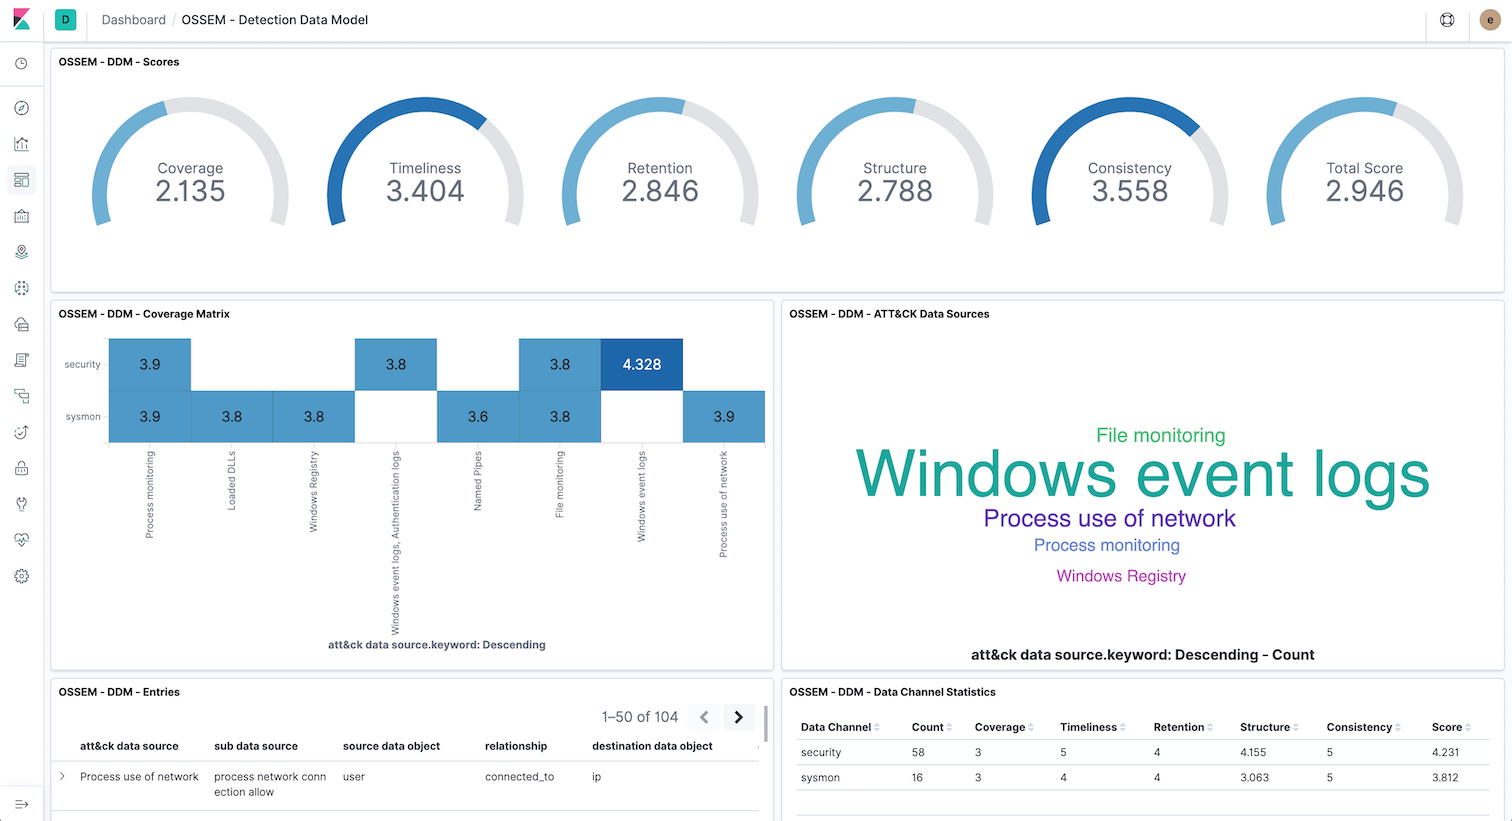
[*] Creating elastic index ossem.dcsWhen exporting to Elastic, power-up will store all OSSEM data in elastic. Because the DDM is also enriched with the respective data quality dimensions, you will be able to create dashboards like this:
Exporting to ATT&CK Navigator
$> python3 powerup.py -o ../OSSEM --layer
_____ _____ _____ _____ _____ _____ _____ _ _ _ _____ _____ _____ _____ __
| | __| __| __| | | _ | | | | | __| __ |___| | | _ | |
| | |__ |__ | __| | | | | __| | | | | | __| -|___| | | __|__|
|_____|_____|_____|_____|_|_|_| |__| |_____|_____|_____|__|__| |_____|__| |__|
[*] Profile path: profiles/default.yml
[*] Parsing OSSEM from markdown
[*] Exporting OSSEM to Naviagator Layer
[*] Pulling ATT&CK data
[*] Generating data source quality layer
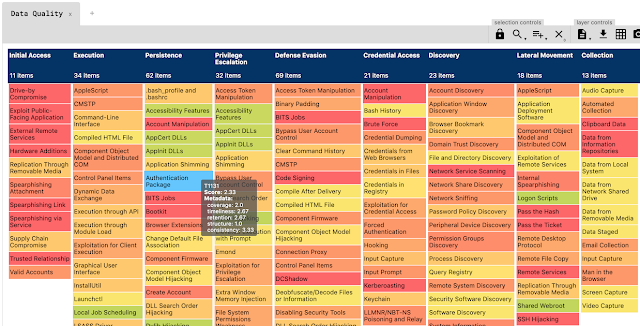
[*] Created output/ds_layer_20191119_220141.jsonWhen exporting to layer, power-up will create an Attack Navigator Layer JSON file, with the respective data quality dimensions for every technique:
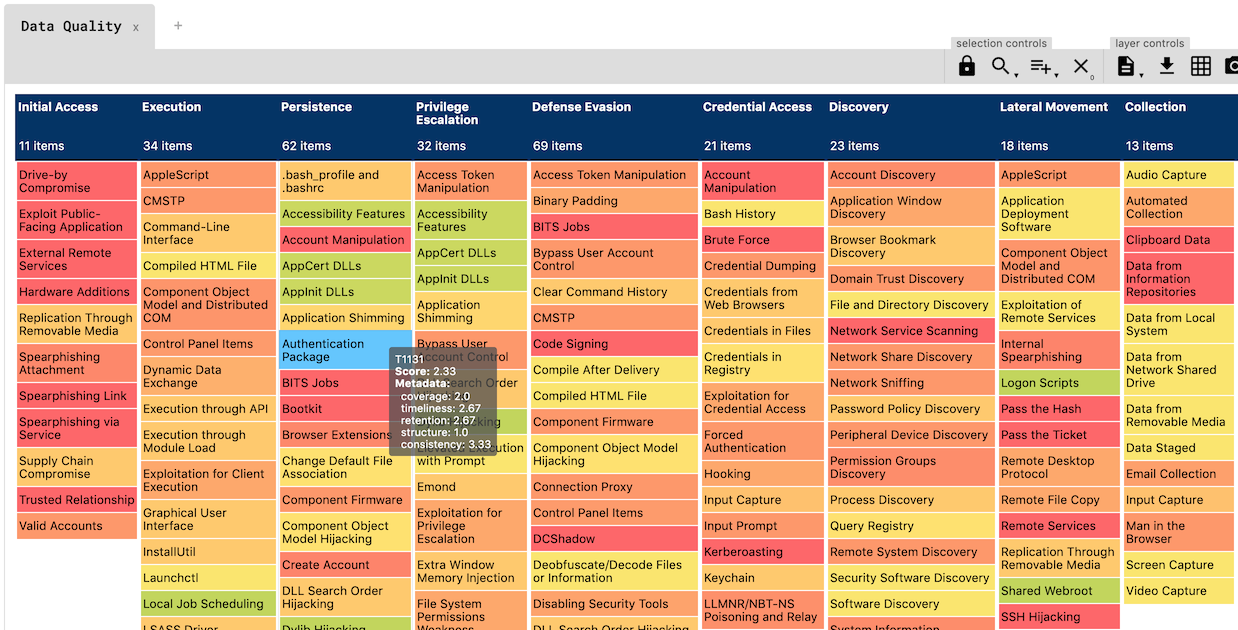
Note: technique scores are derived from data sources average scores in the DDM.
Acknowledgements
- Roberto Rodriguez @Cyb3rWard0g, Jose Luis Rodriguez @Cyb3rPandaH, and all community members for supporting OSSEM.
- Marcus Bakker @bakk3rm and Ruben Bouman @rubenb_2 for the inspiration on the Data Quality Dimensions from DeTTECT.
To-Do
- Create additional documentation
- Export to ATT&CK Navigator Layer
- Properly handle data dictionaries that share the same data channel, but have different schema depending on the operating system
- Provide Kibana objects (visualizations and dashboards)
[sc name=”ad-in-article”]

Add Comment